
The purpose
Debug an HTTP server implemented in Node.js using Visual Studio Code.
environment
Node.js v20.16.0
VisualStudioCode 1.94.2
Debug
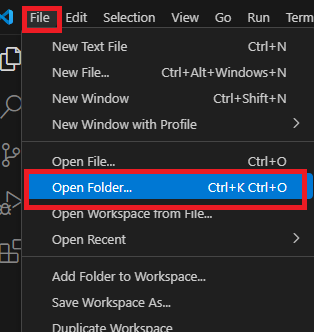
Select “Open Folder…” from the File menu to open the folder containing your project.
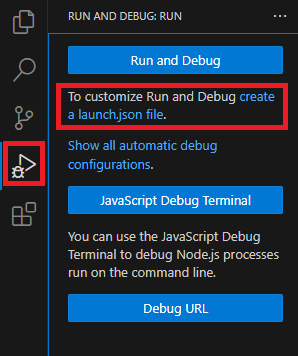
Click “Run and Debug” on the left side of the screen, then click “Create a launch.json file”.
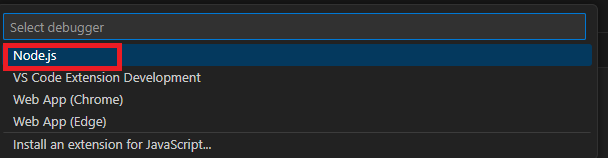
There’s a dropdown menu at the top of the screen; select Node.js from it.
After waiting for a while, a launch.json file will be created in the project folder’s .vscode directory with the following content:
The value of “program": varies depending on the project. Also,
if it’s a different file than the server-side entry point, change it to the server-side entry point’s JavaScript file.。
{
    // Use IntelliSense to learn about possible attributes.
    // Hover to view descriptions of existing attributes.
    // For more information, visit: https://go.microsoft.com/fwlink/?linkid=830387
    "version": "0.2.0",
    "configurations": [
        {
            "type": "node",
            "request": "launch",
            "name": "Launch Program",
            "skipFiles": [
                "<node_internals>/**"
            ],
            "program": "${workspaceFolder}\\server.mjs"
        }
    ]
}
Execute application
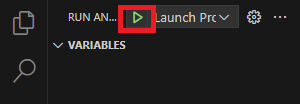
Click the Launch Program icon in the upper left corner.
Debug
Clicking to the left of a line number in the code sets a breakpoint.
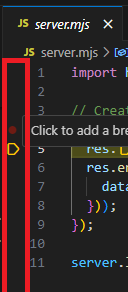
After breaking, you can check the call stack and variables, similar to the Chrome Developer Tools.
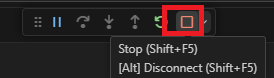
close application
Clicking the Stop icon in the upper part of the screen will close the application.
Result
We are able to debug the Node.js server-side code.
Reference


コメント